

Gantt Charts for Time Management
The Gantt chart is one of the most often used project planning and control tools today. In a study of 750 project managers, the Gantt chart was ranked fourth out of 70 project management tools and approaches [1].
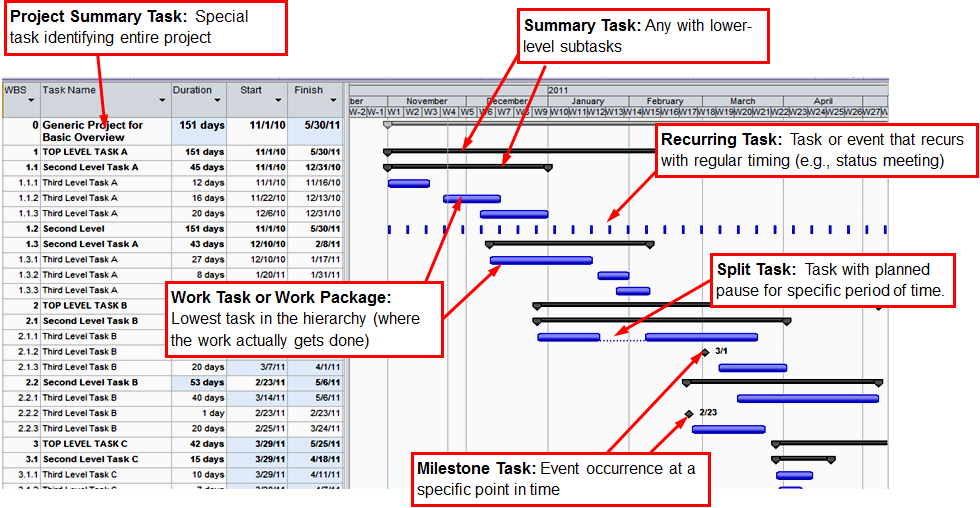
The Gantt chart is built in a timeline structure to make task timing (planned or actual timing) easy to view across time. Throughout the project, Gantt charts may be used to track and illustrate the progress of all tasks. The most frequent graphical method for displaying project time is the Gantt chart. It is frequently used in conjunction with network diagrams and calendar views to communicate project schedule and task linkages. Gantt charts comprise a list of project tasks, a timeframe across the top with user-defined timing intervals (e.g., months or weeks), and task timing bars underneath the timeline.
References
[1] Besner, C. and Hobbs, B. (2008), “Project management praction, generic or contextual: a reality check”, Project Management Journal, Vol. 39 No. 1, pp. 16-33.